Harnessing Wireshark

Background
The ability to effectively analyze network traffic is critical for maintaining security, troubleshooting issues, and optimizing performance. Crafting a tailored Wireshark setup that aligns with specific analysis goals and preferences can significantly enhance efficiency and effectiveness in packet capture analysis. In this post, I'll review some of the basic customization options including display filters, protocol dissectors, and advanced display configurations. These allow users to streamline workflows, focus on pertinent information, and uncover insights that may otherwise remain obscured. In the following walkthrough, we will explore how to set up Wireshark to suit distinct analysis needs.
Downloading Wireshark
Linux
Debian/Ubuntu
sudo apt install wireshark
Fedora
sudo dnf install wireshark
Arch Linux
sudo pacman -S wireshark
GUI Install Option
Windows
macOS
If you don't have Homebrew installed:
/bin/bash -c "$(curl -fsSL https://raw.githubusercontent.com/Homebrew/install/HEAD/install.sh)"
brew install wireshark
GUI Install Option
Custom Display Filters

Triage Analysis
A great way to quickly triage a pcap file is to look at the the following tools found under the Statistics Menu:
- Conversations (Which devices are the noisiest talkers)
- Endpoints
- Protocol Hierarchy (What types of traffic are traversing your network and how much of each make up your overall network traffic?)
- Flow Graphs

Frame Filters
When you're wanting to go straight to a specific packet:
frame.number
frame.len
frame contains "smith"
frame.time_relative > 10
frame.time > "Mar 15, 2024 12:00:00"
frame matches "^[a-zA-Z0-9._%+-]+@[a-zA-Z0-9.-]+.[a-zA-Z]{2,}$"
IP Filters
Filter for a specific IP:
ip.addr
ip.src
ip.dst
| Architecture | TTL |
|---|---|
| Linux/macOS | 64 |
| Windows | 128 |
| Cisco/Juniper | 255 |
ip.ttl == 64
Filter for protocols Wireshark doesn't recognize:
ip.proto
TCP Analysis
For Potential Packet Loss or Network Issues
tcp.analysis.zero_window
tcp.analysis.duplicate_ack
tcp.analysis.fast_retransmission
Protocol Filters
HTTP Traffic
tcp.port == 80
udp.port == 443
Check Session Setups/Teardowns and Analmous Behavior
tcp.flags == 0x002→SYN
tcp.flags == 0x012→SYN, ACK
tcp.flags == 0x014→RST, ACK
tcp.flags.reset == 1
tcp.flags & 0xfe0
HTTP Analysis
Tracking Transactions
http.request.method
http.request.uri
http.host == "thecurious.cloud"
http.content_type
http.content_encoding
Tracking Users
http.user_agent
http.referrer
http.cookie
http.accept_language
http.method.request == "POST"
Tracking Servers
http.server
http.response.code
http matches “(?i)http\/1\.1 [45][0-9]{2}”
Attribution Filters
Geolocation:
ip.geoip.country == "Brazil"
dns.qry.name matches "thecurious.cloud"
ssl.handshake.extensions_server_name == "example.com"
Profiles and Advanced Display Configurations
Setting up profiles in Wireshark can greatly enhance your efficiency and effectiveness in analyzing network traffic. Profiles allow you to customize Wireshark's interface and settings to suit specific tasks, making it easier to focus on relevant data. For instance, having dedicated profiles for different protocols can streamline threat hunting by highlighting suspicious activity pertinent to each protocol. This guide will provide a step-by-step walkthrough for setting up two distinct profiles: one tailored for monitoring HTTP traffic and another for scrutinizing DNS traffic, both crucial for identifying malicious activities.
Setting Up a TLS Custom Profile in Wireshark
Step 1: Create a New Profile
- Open Wireshark.
- Go to
Edit>Configuration Profiles. - Click on
New, name the profileTLS Threat Hunting, and clickOK.
Step 2: Customize Columns
Option 1: The Thorough Approach
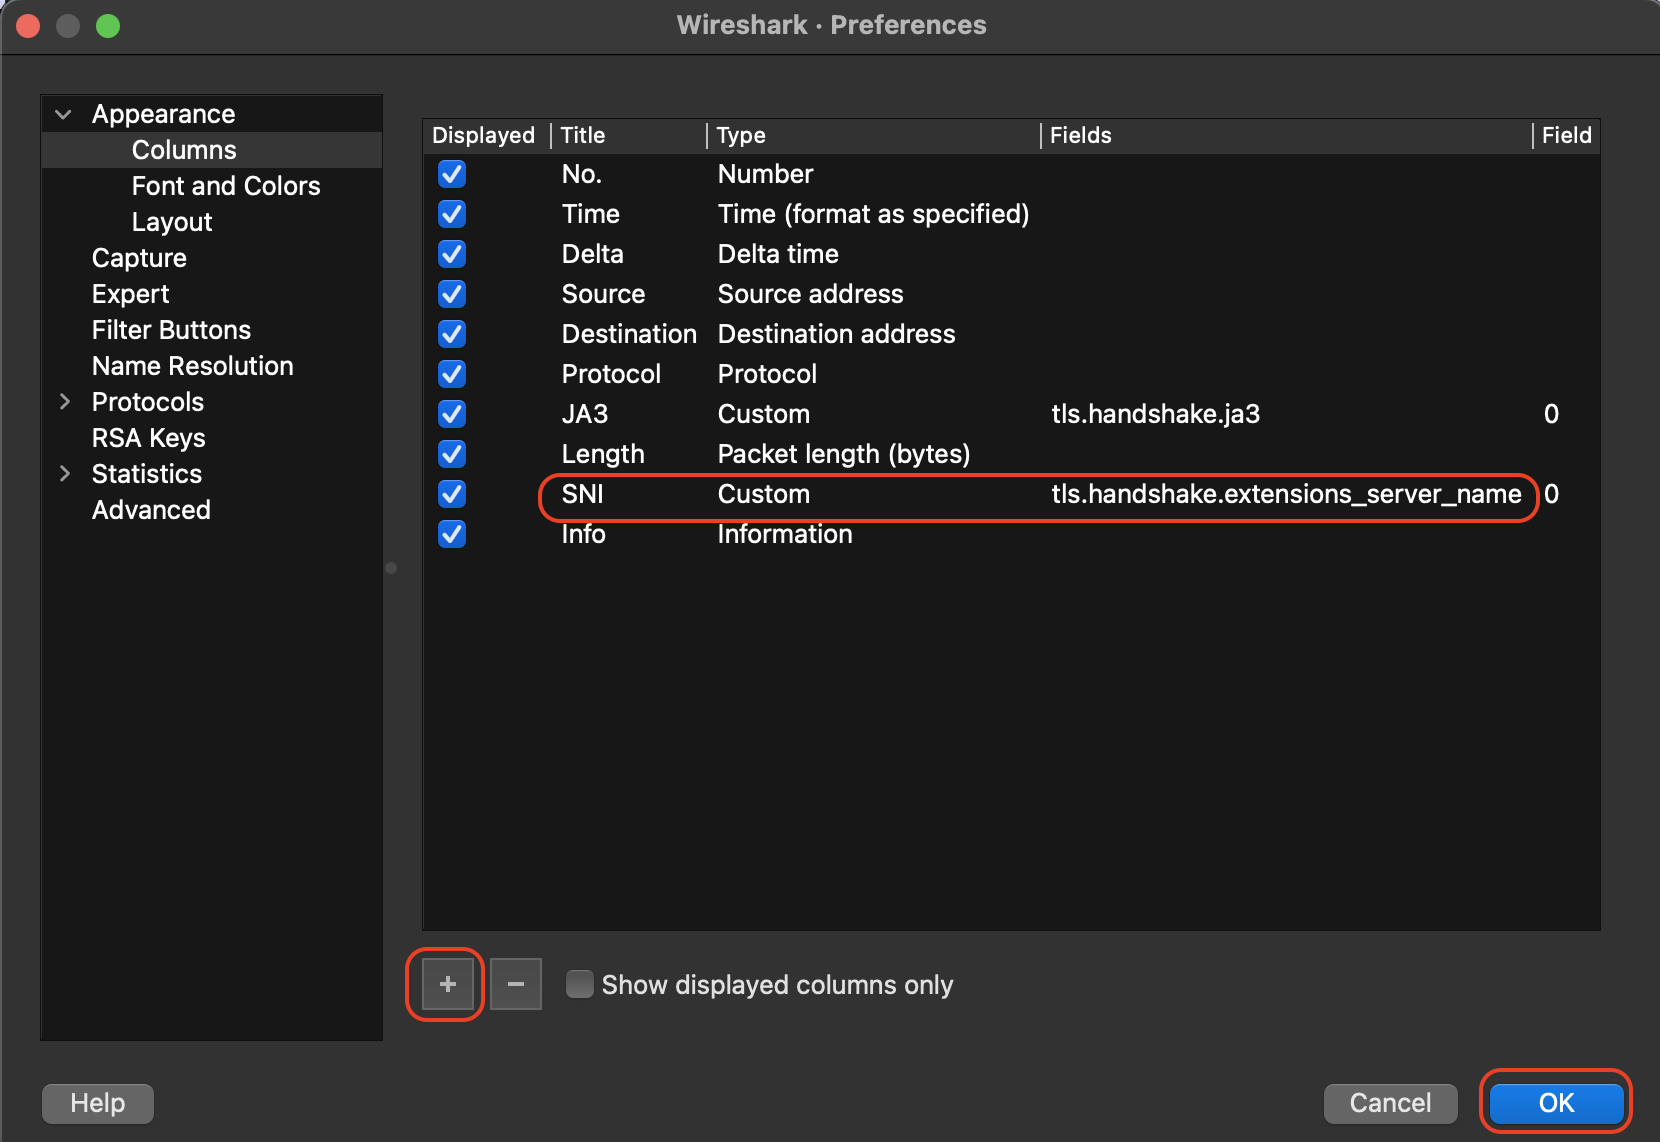
- Right-click on the column header in the packet list pane and select
Column Preferences. - Add a new column by clicking the
+button. - Name the new column
JA3 Fingerprint. - Set the Field Type to
Customand the Field Name totls.handshake.ja3_hash. - Click
OKto save the new column.
Option 2: The Quick and Dirty
- Find the field/value in the
Packet Detailspane. - Right-click on it and select "Apply as Column."
Step 3: Color-Coding TLS Traffic
- Go to
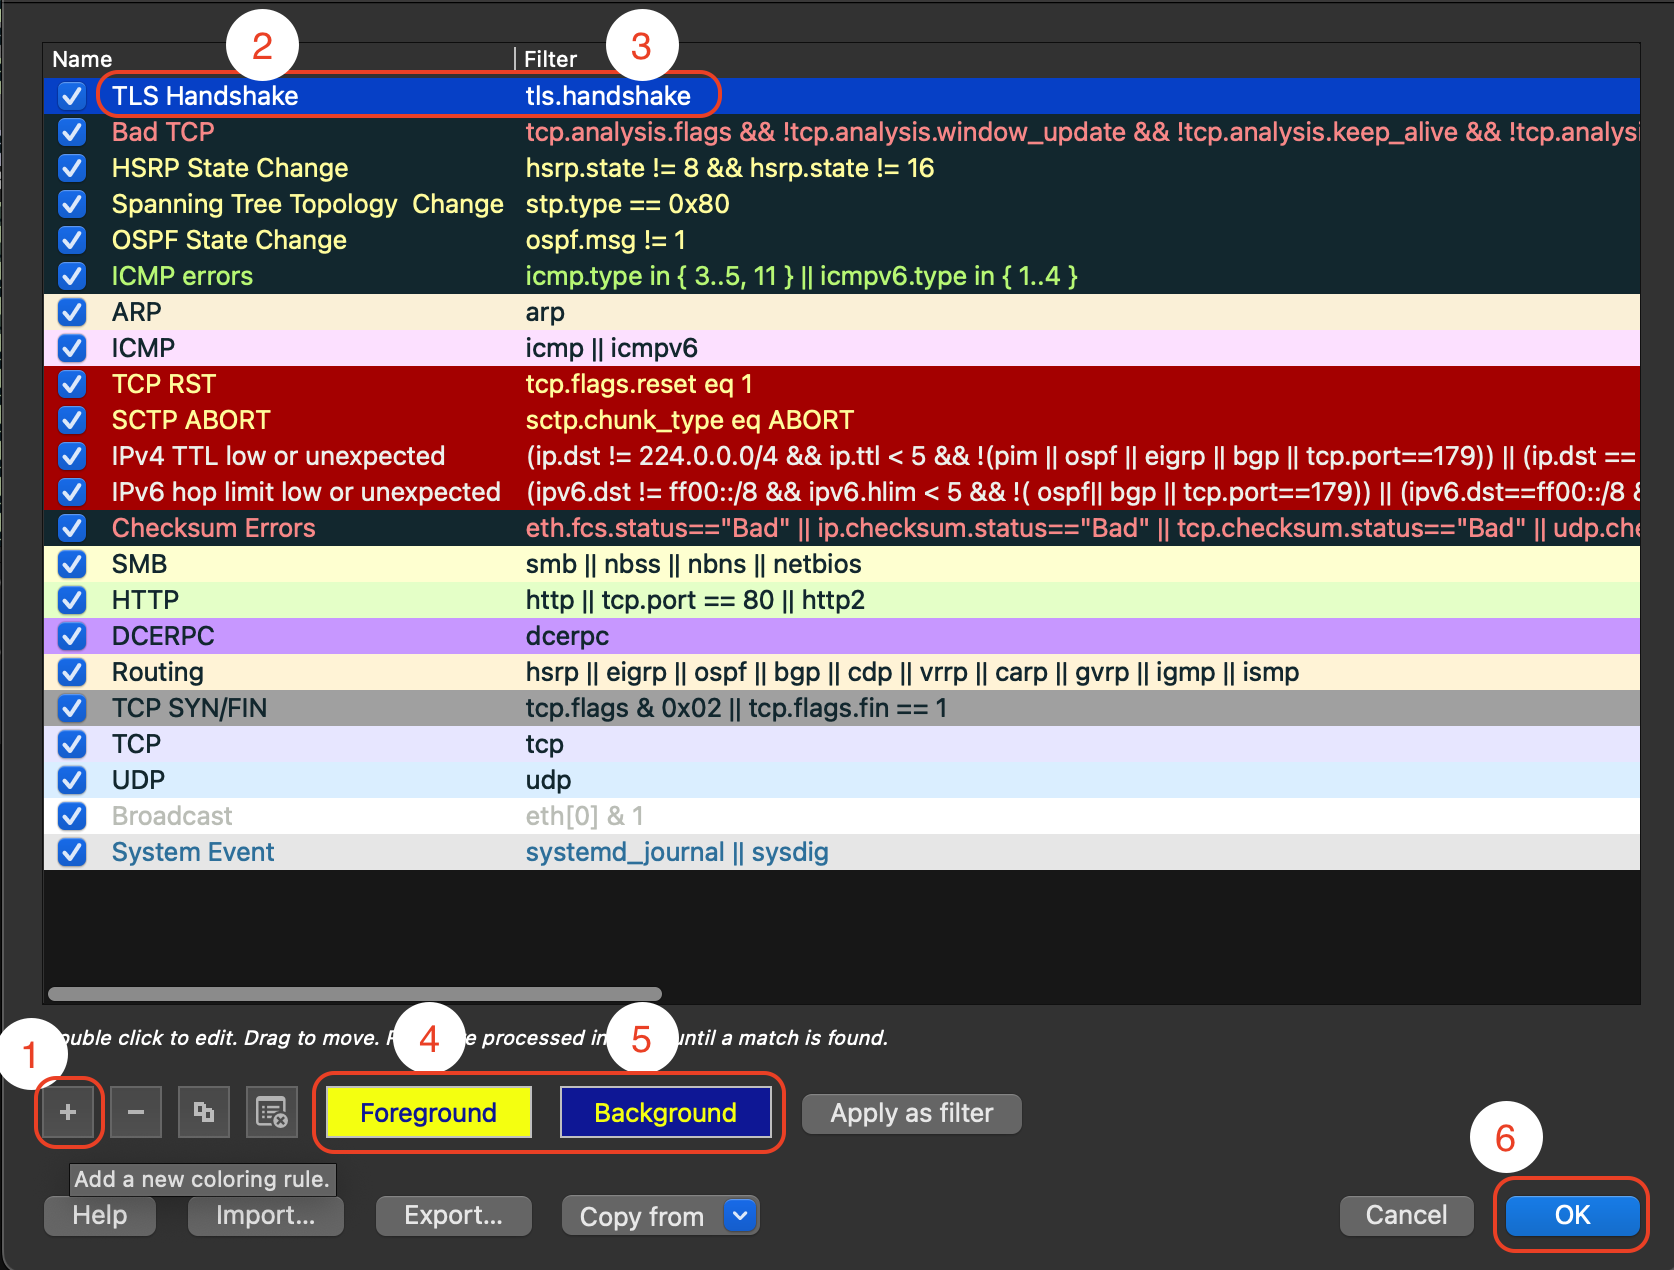
View>Coloring Rules. - Click
+to add a new coloring rule. - Name the rule
TLS Handshake. - Enter the filter:
tls.handshake. - Choose a color for the foreground and background. For example, set the foreground to yellow and the background to a royal blue.
- Click
OKto save the rule.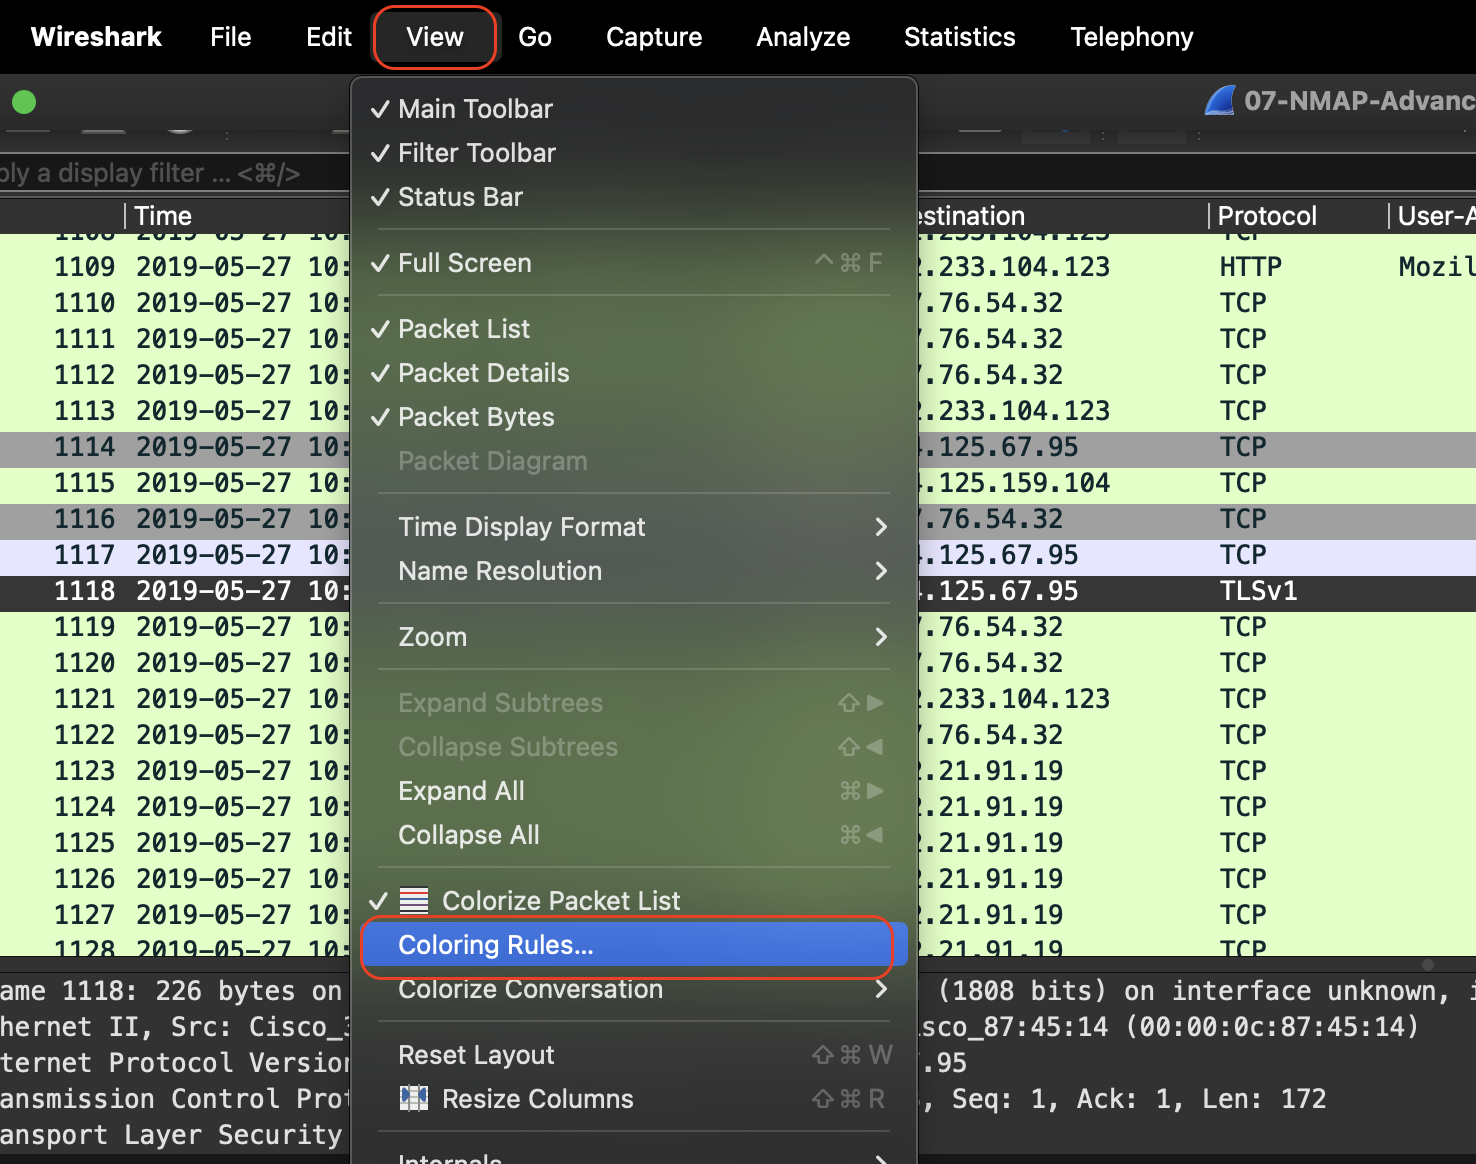
Step 4: Filter for TLS Handshakes
- Create a display filter by typing
tls.handshakein the display filter bar. - Save the filter for quick access:
- Click the
+button next to the display filter bar. - Name the filter
TLS Handshake. - Click
OK.
Example video of adding columns via the Packet Details pane:
Step 5: Save and Apply the Profile
- Click on the profile selector (bottom-right corner) and select
TLS Threat Hunting. - Check the columns and coloring rules to ensure they are applied correctly.
Step 6: Verify JA3 Fingerprint Column
- Capture or open a pcap file containing TLS traffic.
- Check the
JA3 Fingerprintcolumn to ensure it displays JA3 hashes for TLS handshakes.
Step 7: Additional Customizations (Optional)
- Add other useful columns such as
Server Name IndicationorSNI(tls.handshake.extensions_server_name),Cipher Suite(tls.handshake.ciphersuite), orALPN(useful for finding vulnerabilities). - Create more coloring rules for different aspects of TLS traffic, such as specific cipher suites or versions.
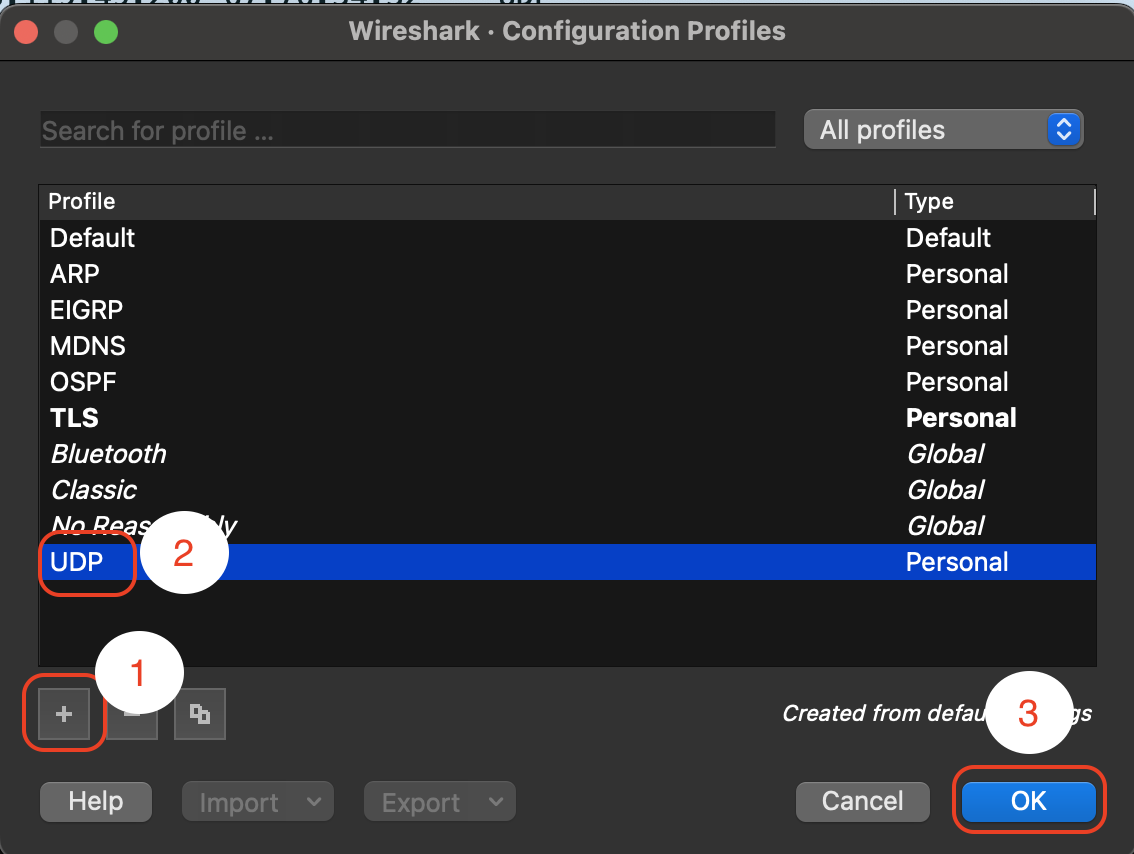
Setting Up a UDP Custom Profile in Wireshark
Step 1: Create a New Profile
- Open Wireshark.
- Go to
Edit>Configuration Profiles. - Click on
+, name the profileUDP, and clickOK.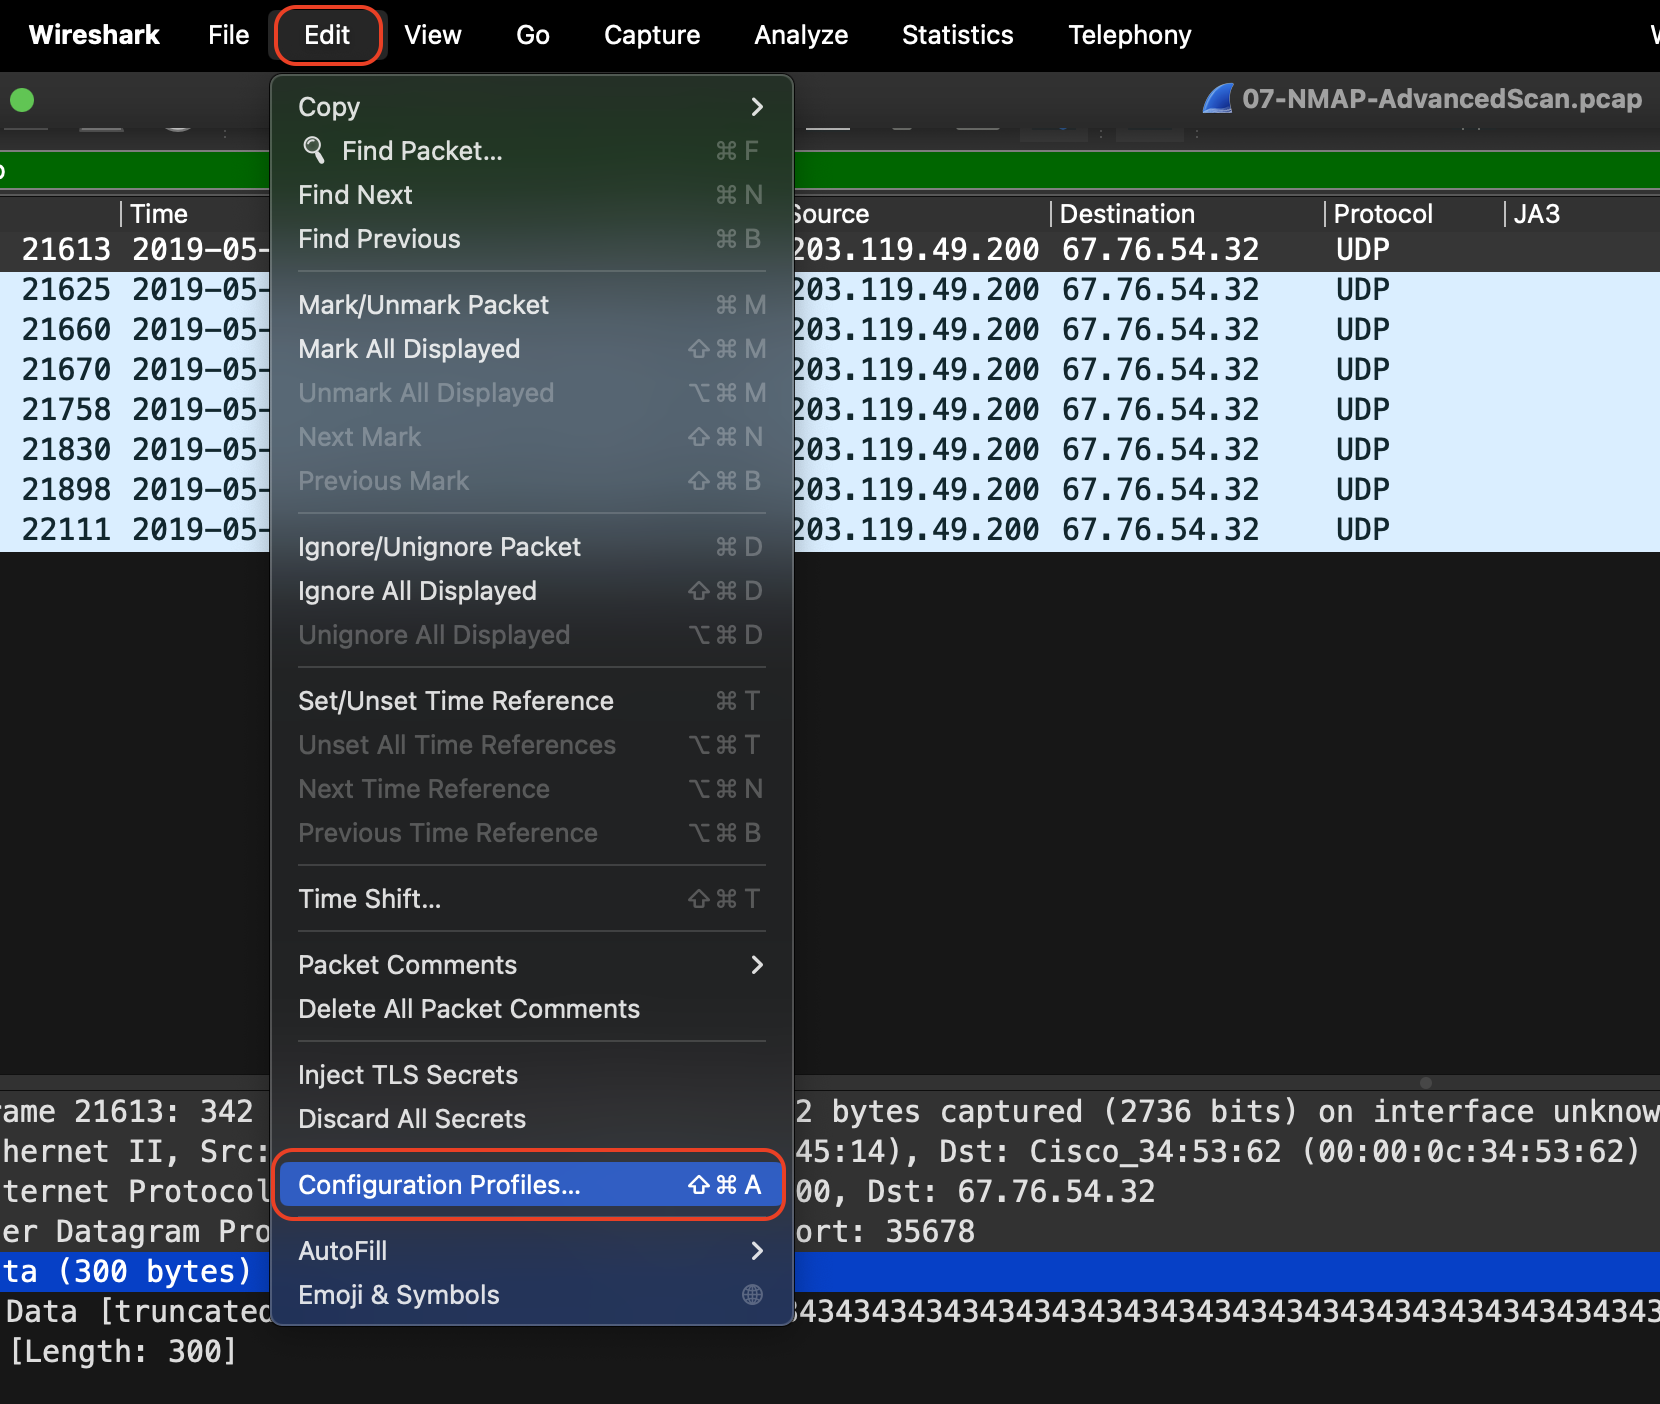
Step 2: Customize Columns
- Right-click on the column header in the packet list pane and select
Column Preferences. - Add a new column by clicking the
+button. - Name the new column
Payload Length. - Set the Field Type to
Customand the Field Name todata.length. - Click
OKto save the new column. Note:udp.lengthincldues the 8 bytes of the UDP header while thedata.lengthis strictly just the payload.
Step 3: Color-Coding UDP Traffic
- Go to
View>Coloring Rules. - Click
+to add a new coloring rule. - Name the rule
UDP Traffic. - Enter the filter:
udp. - Choose a color for the foreground and background. For example, set the foreground to white and the background to blue.
- Click
OKto save the rule.
Step 4: Filter for Specific UDP Ports (e.g., DNS and NTP)
- Create display filters by typing the following in the display filter bar:
- For DNS:
udp.port == 53 - For NTP:
udp.port == 123 - Save the filters for quick access:
- Click the
+button next to the display filter bar. - Name the filters
DNS TrafficandNTP Traffic. - Click
OKfor each.
Step 5: Save and Apply the Profile
- Click on the profile selector (bottom-right corner) and select
UDP Threat Hunting. - Check the columns and coloring rules to ensure they are applied correctly.
Step 6: Additional Customizations (Optional)
- Add other useful columns such as
Source Port(udp.srcport) orDestination Port(udp.dstport). - Create more coloring rules for different types of UDP traffic, such as specific ports or unusual payload lengths.
Transferring Profiles
Once you have your profiles just so, it can be jarring to move to another host where your profiles are not set up. Here's a brief walkthrough on getting them transferred from one host to another and loaded into the new host's Wireshark.
Step 1: Locate the Wireshark Profiles Directory on the Source Host
- Open Wireshark on the source host.
- Navigate to
Edit>Configuration Profiles>Manage Profiles. -
In the Manage Profiles window, click
Open Profiles Directory. This will open the folder where your profiles are stored. Typically, the path is something like:- Linux/Mac:
~/.config/wireshark/profiles/ - Windows:
C:\Users\<YourUsername>\AppData\Roaming\Wireshark\profiles\
- Linux/Mac:
-
Note the directory path for use in the next steps.
Step 2: Transfer the Profile(s) Using scp
(obviously there are many ways this transfer can happen; this is just one example)
- Open a terminal on the source host.
-
Use the
scpcommand to copy the profile folder(s) to the destination host.To transfer a single profile:
scp -r ~/.config/wireshark/profiles/MyProfile username@destination_host:~/.config/wireshark/profiles/ -
Replace
MyProfilewith the name of your profile folder. - Replace
usernameanddestination_hostwith the appropriate SSH credentials for the destination host. -
The
-roption ensures that the entire folder, including subdirectories, is copied.To transfer multiple profiles at once, you can copy the entire
profilesdirectory:scp -r ~/.config/wireshark/profiles/ username@destination_host:~/.config/wireshark/
Step 3: Locate the Wireshark Profiles Directory on the Destination Host
- On the destination host, open Wireshark.
- Navigate to
Edit>Configuration Profiles>Manage Profiles. - Click
Open Profiles Directory. This will open the directory where Wireshark expects the profiles to be.
Step 4: Verify the Transfer
- Ensure the profile(s) you transferred appear in the Wireshark profiles directory on the destination host.
- Close and restart Wireshark if necessary.
Step 5: Load the Profile(s) in Wireshark
- Open Wireshark on the destination host.
- Navigate to
Edit>Profiles>Manage Profiles. - You should see the transferred profile(s) listed. Select the profile you want to use or set one as the default.
Appearance Theme Change
In terminal:
qt6ct
This will open a gui application to select which type of theme you might want.
Add GeoIP Database into Wireshark
The GeoIP Database will resolve IP address locations within Wireshark for further in-tool analysis. This can be helpful for instances like tracking network traffic across different geographical regions, identifying potential security threats by pinpointing the origin of suspicious IP addresses, or simply understanding where your data is flowing globally. Here’s how to set it up:
Step 1. Download the GeoIP Database
- Visit the MaxMind website and download the GeoLite2 City database. This database is free to use after registration.
- After downloading, extract the contents of the
.tar.gzfile to a convenient location on your system.
Step 2. Install Wireshark
- If you don't already have Wireshark installed, download and install it from the Wireshark official website.
- Ensure that you have the latest version to avoid compatibility issues.
Step 3. Set Up GeoIP in Wireshark
- Open Wireshark:
- Launch Wireshark after installation.
- Configure GeoIP Database Locations:
- Go to
Edit>Preferences. - In the left panel, expand the
Name Resolutionsection. - Under the
Name Resolutionsection, findGeoIP database directories. - Click on
Newto add a directory path. - Navigate to the directory where you extracted the GeoLite2 City database and select it.
- Ensure that the paths point directly to the database files (
GeoLite2-City.mmdbfor city data).
- Go to
Step 4. Verify GeoIP Setup
- Start capturing traffic or open a capture file in Wireshark.
- Right-click on any IP address in the packet list pane and choose
Resolve Address. - You should see the geographical information (like country, city, etc.) associated with the IP address.
Step 5. Update Database (Optional)
- The GeoLite2 database is updated periodically by MaxMind. To ensure accurate location data, periodically download the latest version from the MaxMind website and update the path in Wireshark.
View/Replay a Streamed Video
When reviewing a pcap that was streaming video content, it is sometimes possible to extract the raw file from the stream and replay it. The process starts out the same in Wireshark, but then can vary a bit depending on the type of protocol and binary file. Here is what that might look like for each of these protocols:
1. HLS/DASH (HTTP-based Streaming)
- Identify HTTP Segments:
- Use the Wireshark filter:
http - Locate
.m3u8playlist files and.tsor.mp4media segments.
- Use the Wireshark filter:
- Export HTTP Objects:
- Go to File > Export Objects > HTTP.
- Export the
.m3u8playlist file and all associated.tsor.mp4files.
- Playback Option 1 (Direct with
ffplay):- Use
ffplayto directly play a.tssegment:ffplay segment.ts
- Use
- Playback Option 2 (Convert to Single File):
- Use
ffmpegto concatenate the segments:ffmpeg -i "playlist.m3u8" -c copy output.mp4 - Play the
output.mp4file in a media player.
- Use
2. QUIC (HTTP/3)
- Identify QUIC Traffic:
- Use the Wireshark filter:
quic - Locate the streams associated with video content. Look for
stream_idvalues or inspect payloads for metadata.
- Use the Wireshark filter:
- Decrypt and Extract:
- QUIC is typically encrypted. If you have the keys, use Wireshark's TLS decryption option:
- Go to Edit > Preferences > Protocols > QUIC.
- Enter the key file (e.g.,
sslkeylogfile).
- Playback Option 1 (Direct with
ffplay):- Once decrypted, export the video segments and play them directly using
ffplay:ffplay segment.mp4
- Once decrypted, export the video segments and play them directly using
- Playback Option 2 (Convert to Single File):
- Use
ffmpegto join any segments, if needed:- Play theffmpeg -i segment.mp4 -c copy output.mp4output.mp4file.
3. RTMP (Real-Time Messaging Protocol)
- Identify RTMP Streams:
- Use the Wireshark filter:
rtmp - Look for
RTMPpackets carryingvideodata.
- Use the Wireshark filter:
- Follow RTMP Stream:
- Right-click on an RTMP packet and select Follow Stream.
- Save the stream content as a
.flvfile.
- Playback Option 1 (Direct with
ffplay):- Use
ffplayto directly play the.flvfile:ffplay stream.flv
- Use
- Playback Option 2 (Convert to
.mp4):- Use
ffmpegto convert the.flvfile to.mp4:ffmpeg -i stream.flv -c copy output.mp4 - Play the
output.mp4file.
- Use
4. RTP (Real-Time Transport Protocol)
- Identify RTP Streams:
- Use the Wireshark filter:
rtp - Go to Telephony > RTP > Show All Streams.
- Select the stream(s) of interest.
- Use the Wireshark filter:
- Analyze and Save Payload:
- Click on Analyze, then Save As to export the stream as
.rtp.
- Click on Analyze, then Save As to export the stream as
- Playback Option 1 (Direct with
ffplay):- Use
ffplayto play the.rtpfile:ffplay -protocol_whitelist file,rtp -i stream.rtp
- Use
- Playback Option 2 (Convert to
.mp4):- Use
ffmpegto convert.rtpto.mp4:ffmpeg -protocol_whitelist file,rtp -i stream.rtp output.mp4 - Play the
output.mp4file.
- Use
5. RTSP (Real-Time Streaming Protocol)
- Identify RTSP Streams
- Use the Wireshark filter:
rtsp - Look for
DESCRIBE,SETUP,PLAY, andTEARDOWNmessages.
- Use the Wireshark filter:
- Follow and Extract Stream:
- Right-click on the RTSP packet and choose Follow Stream.
- Export the stream payload as a raw file.
- Playback Option 1 (Direct with
ffplay):- Use
ffplayto directly play the extracted raw stream:ffplay -i rtsp_raw_stream
- Use
- Playback Option 2 (Convert to
.mp4):- Use
mplayerorffmpegto reconstruct the raw stream:mplayer -dumpstream -dumpfile video.mp4 rtsp://<stream_url> - Play the
video.mp4file.
- Use
6. UDP (Generic Streaming)
- Identify UDP Streams
- Use the Wireshark filter:
udp && !(dns) - Filter out DNS traffic to locate the potential media stream.
- Use the Wireshark filter:
- Reassemble UDP Stream
- Go to Analyze > Follow > UDP Stream.
- Save the stream data to a file.
- Playback Option 1 (Direct with
ffplay)- Use
ffplayto directly play theudp_stream.rawfile:ffplay udp_stream.raw
- Use
- Playback Option 2 (Convert and Analyze)
- Use
tsharkto extract the payload and convert:tshark -r udp_stream.raw -Y "udp" -T fields -e data > udp_data.raw - Convert or play
udp_data.rawdepending on the encoding.
- Use
Shortcuts
Help > About > Keyboard Shortcuts
| Action | Shortcut |
|---|---|
| Start Capture | Ctrl + E |
| Stop Capture | Ctrl + E (same as Start) |
| Open Capture File | Ctrl + O |
| Save Capture File As | Ctrl + Shift + S |
| Close File | Ctrl + W |
| Quit Wireshark | Ctrl + Q |
| Toggle Between Views (Packet List/Details/Bytes) | Shift + Tab |
| Find a Packet | Ctrl + F |
| Go to Packet | Ctrl + G |
| Mark/Unmark Packet | Ctrl + M |
| Show/Hide Packet Details | Ctrl + Alt + D |
| Show/Hide Packet Bytes | Ctrl + Alt + B |
| Show/Hide Packet List | Ctrl + Alt + L |
| Go to Next Packet | ↓ (Down Arrow) |
| Go to Previous Packet | ↑ (Up Arrow) |
| Move to Next Marked Packet | Ctrl + → (Right Arrow) |
| Move to Previous Marked Packet | Ctrl + ← (Left Arrow) |
| Expand All Tree Items in Packet Details | Ctrl + → (Right Arrow in details view) |
| Collapse All Tree Items in Packet Details | Ctrl + ← (Left Arrow in details view) |
| Apply Display Filter | Enter (when focused on the filter bar) |
| Clear Display Filter | Ctrl + / |
| Zoom In | Ctrl + + (or Ctrl + =) |
| Zoom Out | Ctrl + - |
| Reset Zoom | Ctrl + 0 |
| Capture Options | Ctrl + K |
| Restart Capture | Ctrl + R |
| Copy Summary/Details/Text | Ctrl + Shift + C |